Your personal inflation rate in India: why CPI is not your number
India rebuilt its inflation basket this year. It still does not contain your life.
In July 2026, India’s official inflation was 4.45%. In the same release, health inflation was 1.34% and inpatient hospital care was 1.57% — while Aon tells its corporate clients to budget for medical costs rising 11.5% this year. Your inflation rate is not the headline. But it is probably not higher for the reason you have been told: priced at the government’s own rates, a metro household with a large rent often runs below 4.45%. The gap is not in the basket. It is in three of the rates inside it.
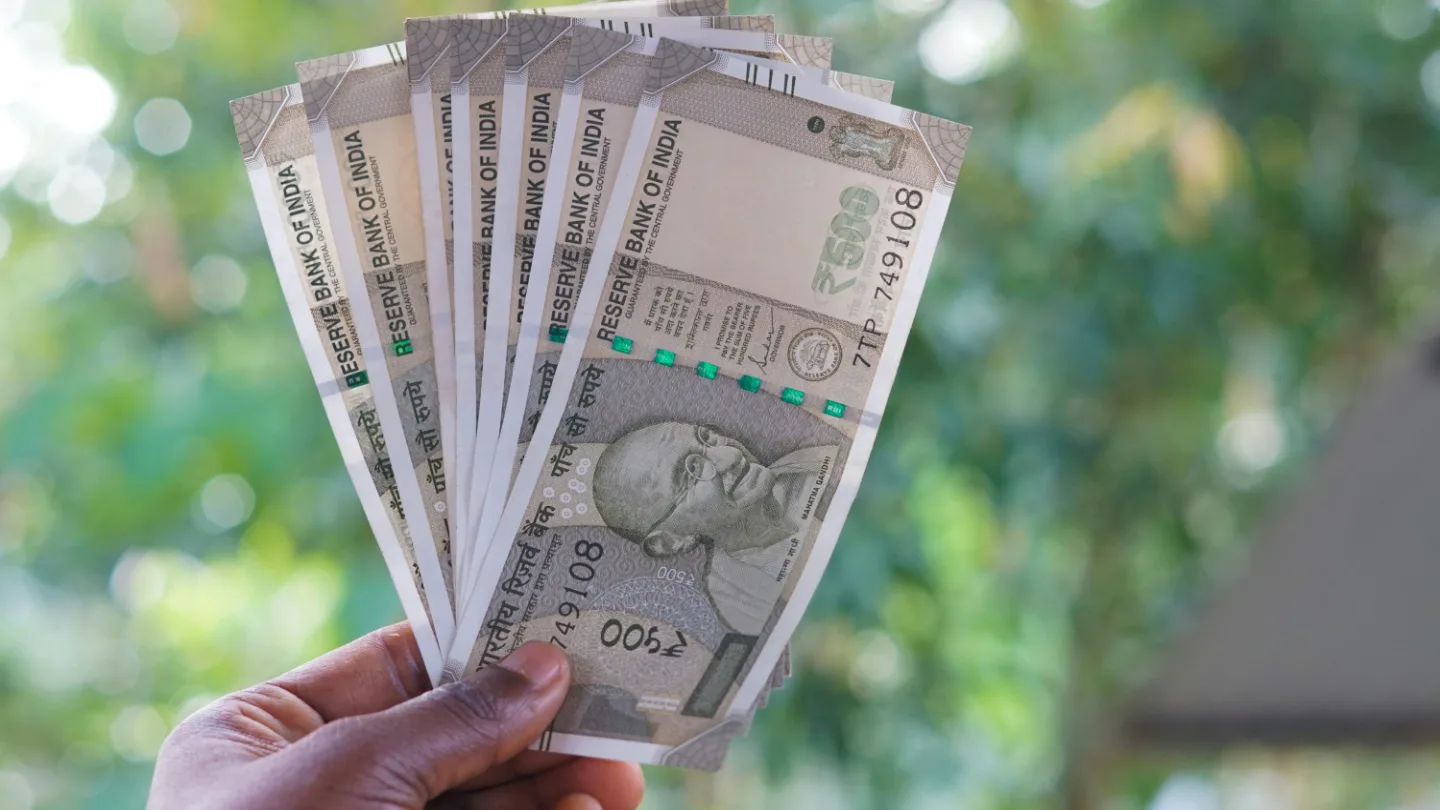
In February, India replaced the number
On 12 February 2026 the Ministry of Statistics and Programme Implementation published the first Consumer Price Index on base 2024=100. It replaced a basket assembled in 2012 — before UPI, before food delivery, before most Indians had a smartphone — with one built from the Household Consumption Expenditure Survey of 2023-24.
The item basket grew from 299 to 358: goods from 259 to 308, services from 40 to 50. The index adopted COICOP 2018, the international classification, which reorganised six familiar groups into twelve divisions. Obsolete items went out. And rural housing entered the index for the first time, carrying a weight of 11.764% in rural areas — under the old series, the cost of rural shelter was simply absent from India’s inflation number.
Almost every report of this got the headline fact wrong
You will have read that food’s weight fell “from 45.86% to 36.75%”. Those two numbers come from two different classification structures and cannot be subtracted from one another. MoSPI addresses this directly in question 40 of its own FAQ: under the CPI 2012 structure, the share of food and beverages “would have declined from 45.86% to 40.10%”. Under the new structure, it went from 42.617% to 36.753%. Both falls are real. Neither is nine percentage points.
That matters beyond pedantry, because the overstated version supports a conclusion the data does not: that the basket has been dramatically re-pointed towards the urban middle class. It has moved that way. It has moved about five and a half points, not nine.
What the government now assumes you spend
Here is the whole basket, with MoSPI’s own recast of the 2012 weights onto the new structure so the columns are like for like. The right-hand column is what each division did in the year to July 2026.
| Division | Weight, CPI 2012 | Weight, CPI 2024 | Inflation, Jul 2026 |
|---|---|---|---|
| Food and beverages | 42.617% | 36.753% | 5.24% |
| Paan, tobacco and intoxicants | 2.380% | 2.989% | 4.79% |
| Clothing and footwear | 6.527% | 6.383% | 3.38% |
| Housing, water, electricity, gas and fuels | 16.888% | 17.665% | 2.16% |
| Furnishings and household maintenance | 3.656% | 4.469% | 2.40% |
| Health | 5.900% | 6.100% | 1.34% |
| Transport | 6.394% | 8.796% | 4.43% |
| Information and communication | 3.323% | 3.609% | 0.63% |
| Recreation, sport and culture | 1.547% | 1.516% | 1.64% |
| Education services | 3.513% | 3.333% | 3.64% |
| Restaurants and accommodation services | 3.246% | 3.348% | 7.72% |
| Personal care and miscellaneous | 4.006% | 5.038% | 14.77% |
Transport is the real winner of the rebasing, up 2.4 points to 8.796%, with information and communication separate at 3.609%. Add them and you get 12.405% of the basket — which is where the “transport and communication now 12.41%” line in the coverage came from, though the two are distinct divisions and inflated at wildly different rates this July: 4.43% against 0.63%.
Education services went down. From 3.513% to 3.333%. MoSPI notes that COICOP separates books and stationery from tuition; including them, the effective education share is 4.0%, against 4.46% under CPI 2012. However you cut it, in the basket built from how India spent in 2023-24, education takes a smaller share than it did in the basket built from 2012.
Health barely moved — 5.900% to 6.100%, a fifth of a percentage point — in a country where households pay for roughly 44% of total health expenditure directly out of pocket, a figure that rose from 39.4% the previous year, reversing a decade of decline.
Then there is the matter of the back series
A rebasing resets the index level. To make the history usable, MoSPI publishes linking factors: 0.5267 for Combined, 0.5222 for Rural, 0.5320 for Urban. Multiply an old-series reading by the factor and you get its new-series equivalent.
Do that arithmetic and an index of 150.2 in January 2020 becomes 79.11. A reading of 198 in December 2025 becomes 104.29. Identical prices, identical inflation, roughly half the number. If you are looking at a chart of “the CPI index” that runs across February 2026 without the linking factor applied, you are looking at a cliff that did not happen. The inflation rate is unaffected, which is the part that matters and the part almost nobody checks.
The health numbers
Look again at the health row. In the year to July 2026, official health inflation was 1.34%. The sub-divisions are, if anything, worse: medicines and health products 1.26%, outpatient care 1.58%, inpatient care 1.57%, other health services 1.25%. Hospitalisation — the single cost most likely to empty an Indian family’s savings — officially rose by less than a rupee and sixty paise per hundred.
In the same year, Aon’s 2026 Global Medical Trend Rates Report put India’s medical trend at 11.5%, moderating from 13% the year before, against an Asia-Pacific average of 11.3% and a global average of 9.8%. That is roughly eight and a half times the official print.
Both numbers are honest
CPI prices a fixed specification: the same procedure, in the same room class, with the same drug, this month against last. Aon’s figure is a medical trend rate — claims cost per member — which blends price with how often people claim, what they claim for, and how treatment itself has changed. When a hospital replaces an open surgery with a robotic one, CPI does its best to treat that as a different product. Your bill treats it as Tuesday.
So the correct reading is not “the government is hiding inflation”. It is that a price index and a spending forecast are different instruments, and a retirement plan needs the second. You are not forecasting a price. You are forecasting a bill — and a bill includes utilisation, which rises relentlessly with age.
Two more things belong in the same paragraph as that 11.5%, because the number gets quoted carelessly. First, GST on individual health and life policies went from 18% to zero on 22 September 2025 — a straight 18% price cut on cover — and retail health premium still grew 19% year on year by February 2026. A tax cut of that size, absorbed inside a year, tells you something about the underlying trend. Second, the figure of “14% medical inflation, per NITI Aayog” appears in almost every insurance advertisement in India. I could not trace it to a NITI Aayog document. It is not used here.
Education, same shape, smaller gap
Officially, education services inflated 3.64% in the year to July 2026. Underneath: early childhood and primary education 4.25%, secondary education 4.33%, higher education 3.52%. In urban India, secondary education ran 4.59%.
The number quoted in every child-education-plan brochure is 10–12%. Like the medical figure, it is not a price index, and I could not trace it to a primary source either — it circulates by citation between fee surveys and asset managers. That does not make it false. A school raising fees 12% is doing exactly that, and CPI’s 4.33% is an average across government and private, metro and district, which describes almost no actual family.
The reconciliation is the same as for health. CPI holds the school constant. A family that moves a child from a ₹60,000 school to a ₹2,00,000 school has experienced a 233% increase in what they pay and roughly 4% inflation, and both statements are true. The index is doing precisely what it says on the tin, being used for a job it never claimed.
So work out your own
Below is your basket instead of the country’s. Put in what you actually spend in a month; the calculator reweights the official divisions to match you and prices them two ways. Official rates uses MoSPI’s own July 2026 sub-index figures, unaltered. Sourced rates changes exactly three rows — health to Aon’s 11.5%, school fees to 10%, rent to an 8% renewal step — and leaves the other three alone, because for those there is nothing credible saying anything different.
Official is MoSPI’s July 2026 sub-index for each division. Sourced swaps three rows for figures from people who have to pay the bill forward, and names each one below.
This calculator needs JavaScript. On paper: divide each line by your total to get its share, multiply each share by that category’s inflation rate, and add the six results together.
—
—
—
—
Run the defaults — a metro household spending ₹1,50,000 a month with two children in private school — and something counterintuitive happens. On official rates it comes out at 3.73%, which is below the 4.45% headline. That household is underweight the two things carrying the national number: food, at 36.753% of the basket, and personal care, where the “other personal effects” sub-group — gold and jewellery — inflated 43.54% in the year to July, taking its whole division to 14.77% and single-handedly contributing about three quarters of a percentage point to the headline.
Switch to sourced rates and the same household jumps to 7.52%, roughly double. Nothing about the basket changed — only what we assume health, fees and rent actually do. That is the finding, and it is the opposite of the usual advice: the problem is not that CPI weights the wrong things for you. On its own weights you may well be fine. The problem is what CPI reports for three rows where a price index and a household bill part company.
The load-bearing sentence
CPI measures the price of a fixed national basket, accurately, and the 2024 rebasing made it a better description of how India spends. It is not, and has never claimed to be, a forecast of one household’s bills. Using it as one is the error — and it is an error that gets made by default in almost every retirement calculator in the country.
What to actually do with the number
Three things, in order of how much they matter.
- Model health separately, and do not use either 1.34% or a flat 11.5%. Neither survives a lifetime. Compounding 11.5% for a fifty-year retirement turns a ₹2 lakh annual medical buffer into something absurd in today’s money; that is why the retirement planner models medical costs at 12% tapering to 8% over twenty years rather than picking a constant and defending it.
- Use your own rate, not the headline, when you size a corpus. Two percentage points over thirty years is not a rounding difference — run it through the inflation calculator and watch what it does to a target. Then run the FIRE calculator at both and treat the spread, not either number, as your answer.
- Know your six numbers. Everything above depends on you knowing what you spent on fees and cover and rent last year, which most people do not, because the information is scattered across a dozen statements and nobody has assembled it.
One last honest note about the fee and rent figures in “sourced rates”. The 10–12% education number and the 8% rent step are conventions, not measurements. I have used the low end of each and labelled them, because a piece complaining that other people quote unsourced numbers does not then get to quote unsourced numbers quietly. If you know your own school’s actual fee history, use it — it will beat any survey.
Questions worth asking
Why did India change the CPI base year to 2024?
Because the 2012 basket had stopped describing how Indians spend. MoSPI rebased the index to 2024=100 and drew new weights from the Household Consumption Expenditure Survey of 2023-24, first published in February 2026. The basket grew from 299 items to 358, adopted the international COICOP 2018 classification, and brought rural housing into the index for the first time. Food and beverages fell from 45.86% of the basket to 40.10% on a like-for-like comparison.
Is the new CPI series comparable to the old one?
The inflation rates are comparable; the index levels are not. MoSPI rescaled the back series using linking factors of 0.5267 for Combined, 0.5222 for Rural and 0.5320 for Urban. An index reading of 150.2 on the old 2012 base becomes 79.11 on the new one, describing exactly the same prices. Any chart that plots the CPI index level across February 2026 without applying the linking factor is showing a cliff that never happened.
Why is my personal inflation rate different from CPI?
Not for the reason usually given. CPI weights a national basket, so a metro household is underweight food, which is 36.75% of the index. Priced at CPI’s own sub-index rates, such a household often runs below the headline rather than above it. The real divergence is in the rates CPI reports for health and education, not in the weights, because a price index deliberately excludes the utilisation and quality changes that make a real medical bill grow.
Why does official health inflation say 1.34% when insurers price 11.5%?
Because they measure different things and both are honest. CPI prices a fixed specification of treatment: the same procedure, the same room class, the same drug. Aon’s 11.5% India medical trend rate is claims cost per member, which blends price with how often people claim, what they claim for and how treatment has changed. A retirement plan needs the second, because it is forecasting a bill rather than a price.
What is education inflation in India?
Officially, 3.64% in July 2026, with early childhood and primary at 4.25% and secondary at 4.33%. The 10-12% figure quoted everywhere is not a price index and this piece could not trace it to a primary source. Both can be true at once: CPI holds the school constant, while a family moving a child to a better school experiences the fee difference as an increase. Education services carry just 3.33% of the CPI basket, down from 3.51%.
Related
You cannot compute your own rate if you do not know your own six numbers
Everything above needs one input most people do not have: what you actually spent, by category, over the last year. TLDR Money’s app keeps that record — type or say what you spent — so the six numbers are there when you want them.
Join the waitlistWe’ll email you when it’s ready. No spam, ever.
Sources
- MoSPI — Press Release of Consumer Price Index on Base 2024=100 for July 2026, dated 12 August 2026. Headline 4.45%, and the division and sub-division rates in the table above (Annexures I and II).
- MoSPI — Frequently Asked Questions on the CPI 2024 Series. Weights for both structures (Q39), the food share on the 2012 structure (Q40), the education share (Q41), the item counts (Q23) and the linking factors (Q38).
- MoSPI — Consumer Price Index. The monthly releases and the CPI 2024 documentation.
- Aon — India Outpaces Global Average With 2026 Medical Trend At 11.5 Percent. The 11.5% India medical trend rate for 2026, the 13% figure for 2025, and the Asia-Pacific and global averages.
- ORF — National Health Accounts: public spending finally overtakes out-of-pocket spending. Out-of-pocket expenditure as a share of total health spending.
This is an explanation, not advice about your money. TLDR Money is not a registered investment adviser and earns no commission on any product mentioned. Figures are illustrative; your own numbers, taxes and circumstances will differ.